
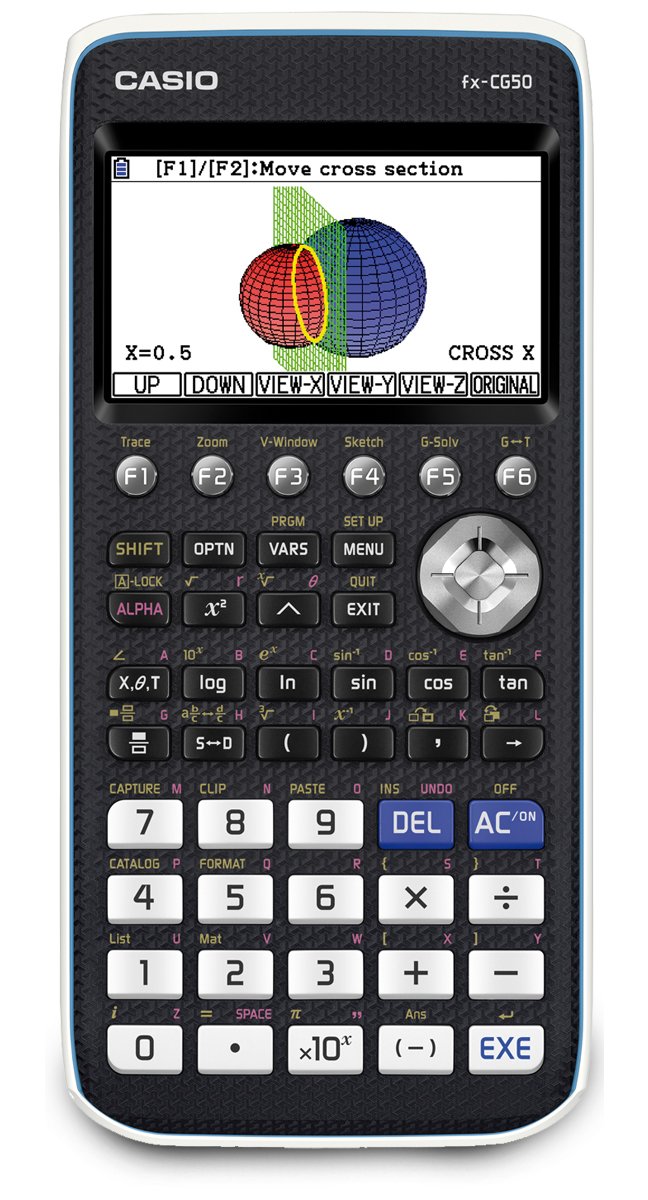

Overview 3D Representation Results of calculations can be displayed as three-dimensional graphs. Up to three different types of 3D graphs can be displayed superimposed – for example, to visualize the intersections of a sphere. Improved graphical solution of integral integrals can be determined between all significant points: intersections, zero places, and manual values. The integral values are displayed interactively with the upper boundary changes. Multiple graphs The differentiation of several graphs in the coordinate system is facilitated by different colourways. Axis labels provide a clear appearance. Standard deviation and variance The standard deviation and variance commands are found in the stochastic commands. Measurement data acquisition with ECON The C-Lab allows the graphic calculator to receive and display sensor data graphically: e.g. temperature gradients, distance measurements or triaxial acceleration values. Random Simulation With the add-in, the simulation of cube, urn or game card experiments is more visual. Various random experiments can be simulated. The parameters can be changed in many ways. During the simulation, graphs, e.g. histograms are already created. Equation solver and equation system solver finds up to 10 exact solutions with fractures, PI and root. The Equation System Solver solves up to 6 equations and Unknown Uniquely solvable and superdefined equation systems are solved. Vector calculation The FX-CG50 now calculates vectors in natural representation. New commands for the scalar product, cross product, or for the unit vector facilitate handling of vectors in the FX-CG50. Computer connection as a storage device The FX-CG50 logs on like a USB stick when connected to the PC, making it easier to exchange data.
Trustpilot
3 days ago
2 days ago
